Monday, December 7, 2009

From the New York Times:


Excerpted from the article, regarding the hiring end of the employment equation:
The discrimination is rarely overt, according to interviews with more than two dozen college-educated black job seekers around the country, many of them out of work for months. Instead, those interviewed told subtler stories, referring to surprised looks and offhand comments, interviews that fell apart almost as soon as they began, and the sudden loss of interest from companies after meetings.

Whether or not each case actually involved bias, the possibility has furnished an additional agonizing layer of second-guessing for many as their job searches have dragged on.
A follow-up article deals with the issues surrounding resumes specifically, called "Whitening" the Resume. This is all reminiscent of a study done back in 2004, called Are Emily and Greg More Employable than Lakisha and Jamal?, which found that identical resumes sent with "white sounding" names were a full fifty percent more likely to receive a callback for an interview than those with "black sounding" names.

Most of the data in the Times articles comes from Friday's report from the Bureau of Labor Statistics.

Tuesday, September 8, 2009

President Obama's Message to Students


And you can read the text of his speech here.

Sunday, April 19, 2009

As Green As You Think? Consider the Life Cycle

From the New York Times:


The bottom line:
One stainless steel bottle is obviously much worse than one plastic bottle. Producing that 300-gram stainless steel bottle requires seven times as much fossil fuel, releases 14 times more greenhouse gases, demands the extraction of hundreds of times more metal resources and causes hundreds of times more toxic risk to people and ecosystems than making a 32-gram plastic bottle. If you’re planning to take only one drink in your life, buy plastic.
[...]
What it comes down to is this: if your stainless steel bottle takes the place of 50 plastic bottles, the climate is better off, and if it gets used 500 times, it beats plastic in all the environment-impact categories studied in a life cycle assessment.

Monday, April 6, 2009

The God-Einstein-Oppenheimer Dice Puzzle

From Tierney Lab:
"God does not throw dice," Albert Einstein famously declared, but suppose he was wrong. Suppose God decided to demonstrate otherwise by showing up one day at the Institute for Advanced Study. God announces that dice games are in fact wildly popular in heaven, and that the purpose of this visit it to teach a new game to Einstein and J. Robert Oppenheimer. God explains the rules:
There are three blank dice. First, Oppenheimer will take each of the six-sided dice and write the numbers from 1 to 18, in any order he likes, on the 18 faces of the three dice. Einstein will then examine the dice and select one of them as his own. Oppenheimer will then examine the remaining two dice and select one of them. (The third die will be discarded.) Oppenheimer and Einstein will then play repeated rounds of “Dice War” in which they roll the dice simultaneously, with a point being awarded each round to the player who rolls the higher number. The player with the most points wins.
Assume that Oppenheimer and Einstein employ the smartest possible strategies, and that the outcome will be determined by the laws of probability (meaning that God doesn’t skew the dice or the influence the rolls). Which player, if either, is favored to win?

For extra credit, imagine the conversation before, during or after the game.
If you want to test out your theory on who will win and how, here's a handy Dice War simulator.

Friday, April 3, 2009

The Perfect Sunset

Recently, I showed a student of mine a Flash applet from the Astronomy Department at the University of Nebraska-Lincoln. It very generally demonstrates how the sunset changes its North-South location on the horizon during the course of the year (due largely to the tilt in the Earth's axis).

In talking about the sunset's movement, my student expressed to me a lifelong desire: to see the sun setting over the Golden Gate Bridge. It takes a little figuring out, since not only does the sunset move during the year but where it happens depends on where on Earth you are (eg If you are far North of the Equator during the summer, then sunset will appear to happen much farther North than if you were standing at the Equator)!

After thinking about different locations in the East Bay to view the Golden Gate Bridge from, I've determined that Cesar Chavez Park is the optimal place (or possibly the nearby Berkeley Pier).


Latitude is a measure of how far North or South a place on the Earth is from the Equator, so knowing the latitudes of both Cesar Chavez Park and the Golden Gate Bridge will help us to find the date of our particular sunset. Latitude is given in degrees, like the way you measured angles in Geometry.

The Flash applet below gives you control over the Time of Day, Date, and Latitude of the observer. Given that
Latitude of Chavez Park: 37.87oN
Latitude of Golden Gate Bridge: 37.82oN
can you use the Flash applet below to find the date of the perfect sunset?

[There are some hints below the applet that may help you.]


Key (for 3-D Observation Simulator)
Hint 1
If you're feeling stuck, play around with the Date and Latitude. See what happens in different places at different times of year. What patterns can you find?

Hint 2
Pay close attention to the Sun's Declination. Go ahead and read about it on Wikipedia. There's a continuous measure of declination in the box in the lower left of the applet.

Hint 3
The latitudes of Cesar Chavez Park and the Golden Gate Bridge are just 0.05o apart. How significant is that in our calculations, considering that our accuracy is limited by that of the applet?

Falling Into a Black Hole

So if you've ever wondered what it might look like to fall into a Black Hole, wonder no longer! From an article at New Scientist, researchers at the University of Colorado - Boulder
built a computer code based on the equations of Einstein's general theory of relativity, which describes gravity as a distortion of space and time.

They follow the fate of an imaginary observer on an orbit that swoops down into a giant black hole weighing 5 million times the mass of the sun, about the same size as the hole in the centre of our galaxy.
[Note: There are more details on what exactly is happening in the video in the article linked above.]


Thanks to Mr. Jue over at the fledgling STEMpowerment blog for the article.

Tuesday, March 24, 2009

Planetary Orbits

From the Astronomy Department at the University of Nebraska-Lincoln:

Thursday, March 19, 2009

This is Why You Pay Attention in Science Classes

According to a national survey, commissioned by the California Academy of Sciences:
  • Only 53% of adults know how long it takes for the Earth to revolve around the Sun
  • Only 59% of adults know whether or not the earliest humans and dinosaurs lived at the same time
  • Only 47% of adults can roughly approximate the percent of the Earth's surface that is covered with water
    • Only 21% of adults answered all three questions correctly

Wednesday, March 18, 2009

Another Year, Another Call for Water Rationing in California...

Even though it's been rainy on and off for the past month or so, I keep seeing articles in the news, like this one from the New York Times, about the drought that California is going through. Apparently, rain has been hitting the Bay Area but not really much else... for three years running. The Times article talks a lot about the impact of the drought on farming communities in the Central Valley (less rain = fewer crops = fewer jobs) and the intensification of hardships that out-of-work farmers face because of the Financial Crisis.

Along with the drought comes the annual call from the governor's office to ration water. Just two weeks ago:
The governor called for a statewide water conservation campaign and asked all urban water users to immediately reduce their individual water use by 20 percent.
After I read about the call for water rationing, I started wondering to myself,

How much of a difference does 20% of my personal water usage make?
  • From the U.S. Geological Survey: In 2000, the U.S. used 408 billion gallons of water in total per day
  • 43 billion gallons per day were used for the "Public Supply" (that's like plumbing and water fountains)
  • From the Environmental Protection Agency: About half of the Public Supply goes to residences, people's homes (the other half goes to office buildings, schools, etc)
    • That means that about 21.5B gallons per day were used residentially in 2000 (ie 1/2 of 43B gallons)
  • 21.5 billion gallons (Residential) ÷ 408 billion gallons (Total) = 0.0526 = ~5%
    • Residential water use in the U.S. accounts for about 5% of total water usage
Just 5% of total water usage is in people's homes, and yet the governor is asking us to tighten our belts. Don't get me wrong, we should be trying to minimize our personal water consumption all the time, not just during droughts. However, since residential consumption is such a small part of the total, if we all reduced our personal (ie residential) consumption by 20%, that would still only mean a 1% reduction over all for total water usage.
  • 20% (reduction in residential usage) of 5% (residential usage as percent of total usage)
    • 20% of 5% = .20 x .05 = .01 = 1%
This all is just to demonstrate that residential water consumption is just a drop in the bucket, so to speak. Reducing water usage is a good habit to have, however the real water usage is clearly elsewhere.


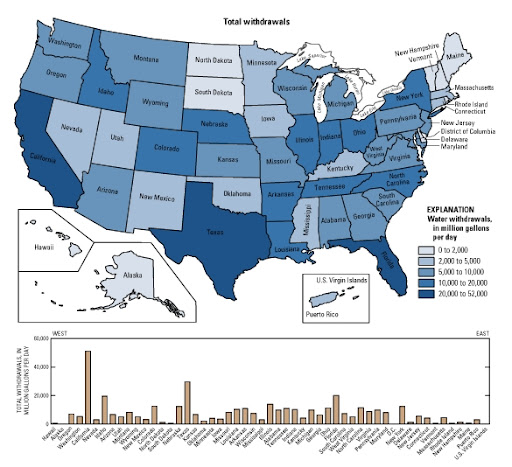
CA is by far the largest water-consuming state, dwarfing even TX, the second largest

Where is all the water going?

There two major uses of water: agriculture and electricity. It makes sense that a lot of water would go to farming; crops need clearly need it. Indeed, Governor Schwarzenegger is asking us to reduce our personal water consumption, so that more water can be directed towards irrigation. The present drought means that the sky isn't providing the water crops need in the form of rain. The other major use of water is the less obvious one: electricity. The majority of electricity in the U.S. is produced in Fossil Fuel burning power plants. These plants burn coal or oil to produce a great amount of heat, which is used to boil water. The steam from the water spins a turbine, which as it rotates creates electricity.
  • As was stated earlier, 408B gallons are consumed per day
  • 137B gallons go to Irrigation
    • 137B ÷ 408B = .3357 = ~34%
  • 196B gallons go to Power Plants
    • 196B ÷ 408B = .4803 = ~48%
  • So, Irrigation accounts for 34% of the Total U.S. water consumption, whereas Electricity accounts for 48%

If we really are serious about cutting down the amount of water that is consumed, not just in California but in the whole U.S., we need to consider more than just residential use. Cutting residential use by 20% could save up to 4 billion gallons of water per day: that's a HUGE amount of water we are just flushing away!

However, to really save water, we need to move away from Fossil Fuel burning Power Plants. Not only do they account for almost half of U.S. water consumption, but they produce Green House Gases that contribute to Global Warming. There are alternative modes of electricity production that use significantly less water and produce no Green House Gases. While we're at it, we should reconsider our farming practices which create a great deal of Green House Gases as well. Now is the time to really examine how we, as a state and country, use our resources and impact the environment.

[Note: For the most complete breakdown of U.S. water consumption by state and end-use, check out this chart from the U.S. Geological Survey. It provides a much more complex picture for changing our state and national priorities.]

Thursday, March 5, 2009

Internet Resources on the Housing/Finanacial Crisis: III

This is a really nifty video that explains how the Financial Crisis happened (and is still happening) in the US. It's got all the info you need to understand what's happening in the news -- just don't get intimidated by the big words (all of them get explained eventually).


The video above is about 11 minutes long and explains what happened in broad terms. It give the essential background of the Crisis.

On the other hand, if you would like a detailed account of the specific decisions made and actions taken by both the Wall Street banks and the US Government as the crisis unfolded over the Summer and Fall of last year (to try to stop the banks from failing), then check out this (hour long) video. It's an episode of Frontline, called (menacingly) "Inside the Meltdown."

Also, I've been posting links to the episodes of the radio show This American Life that similarly explain the Financial Crisis in ways that people can actually understand. Well, they just aired a new one about what the US Government is trying to do right now to save our sinking economy (and why it's so hard to figure out what to do). It's called, Bad Bank.